The reported errors in the ATLAS phase-curve fits appear to be coming out way too small. I’m calculating them as the square-root of the diagonals of the resulting co-variance matrix returned by scipy’s curve_fit.
perr = np.sqrt(np.diag(pcov))
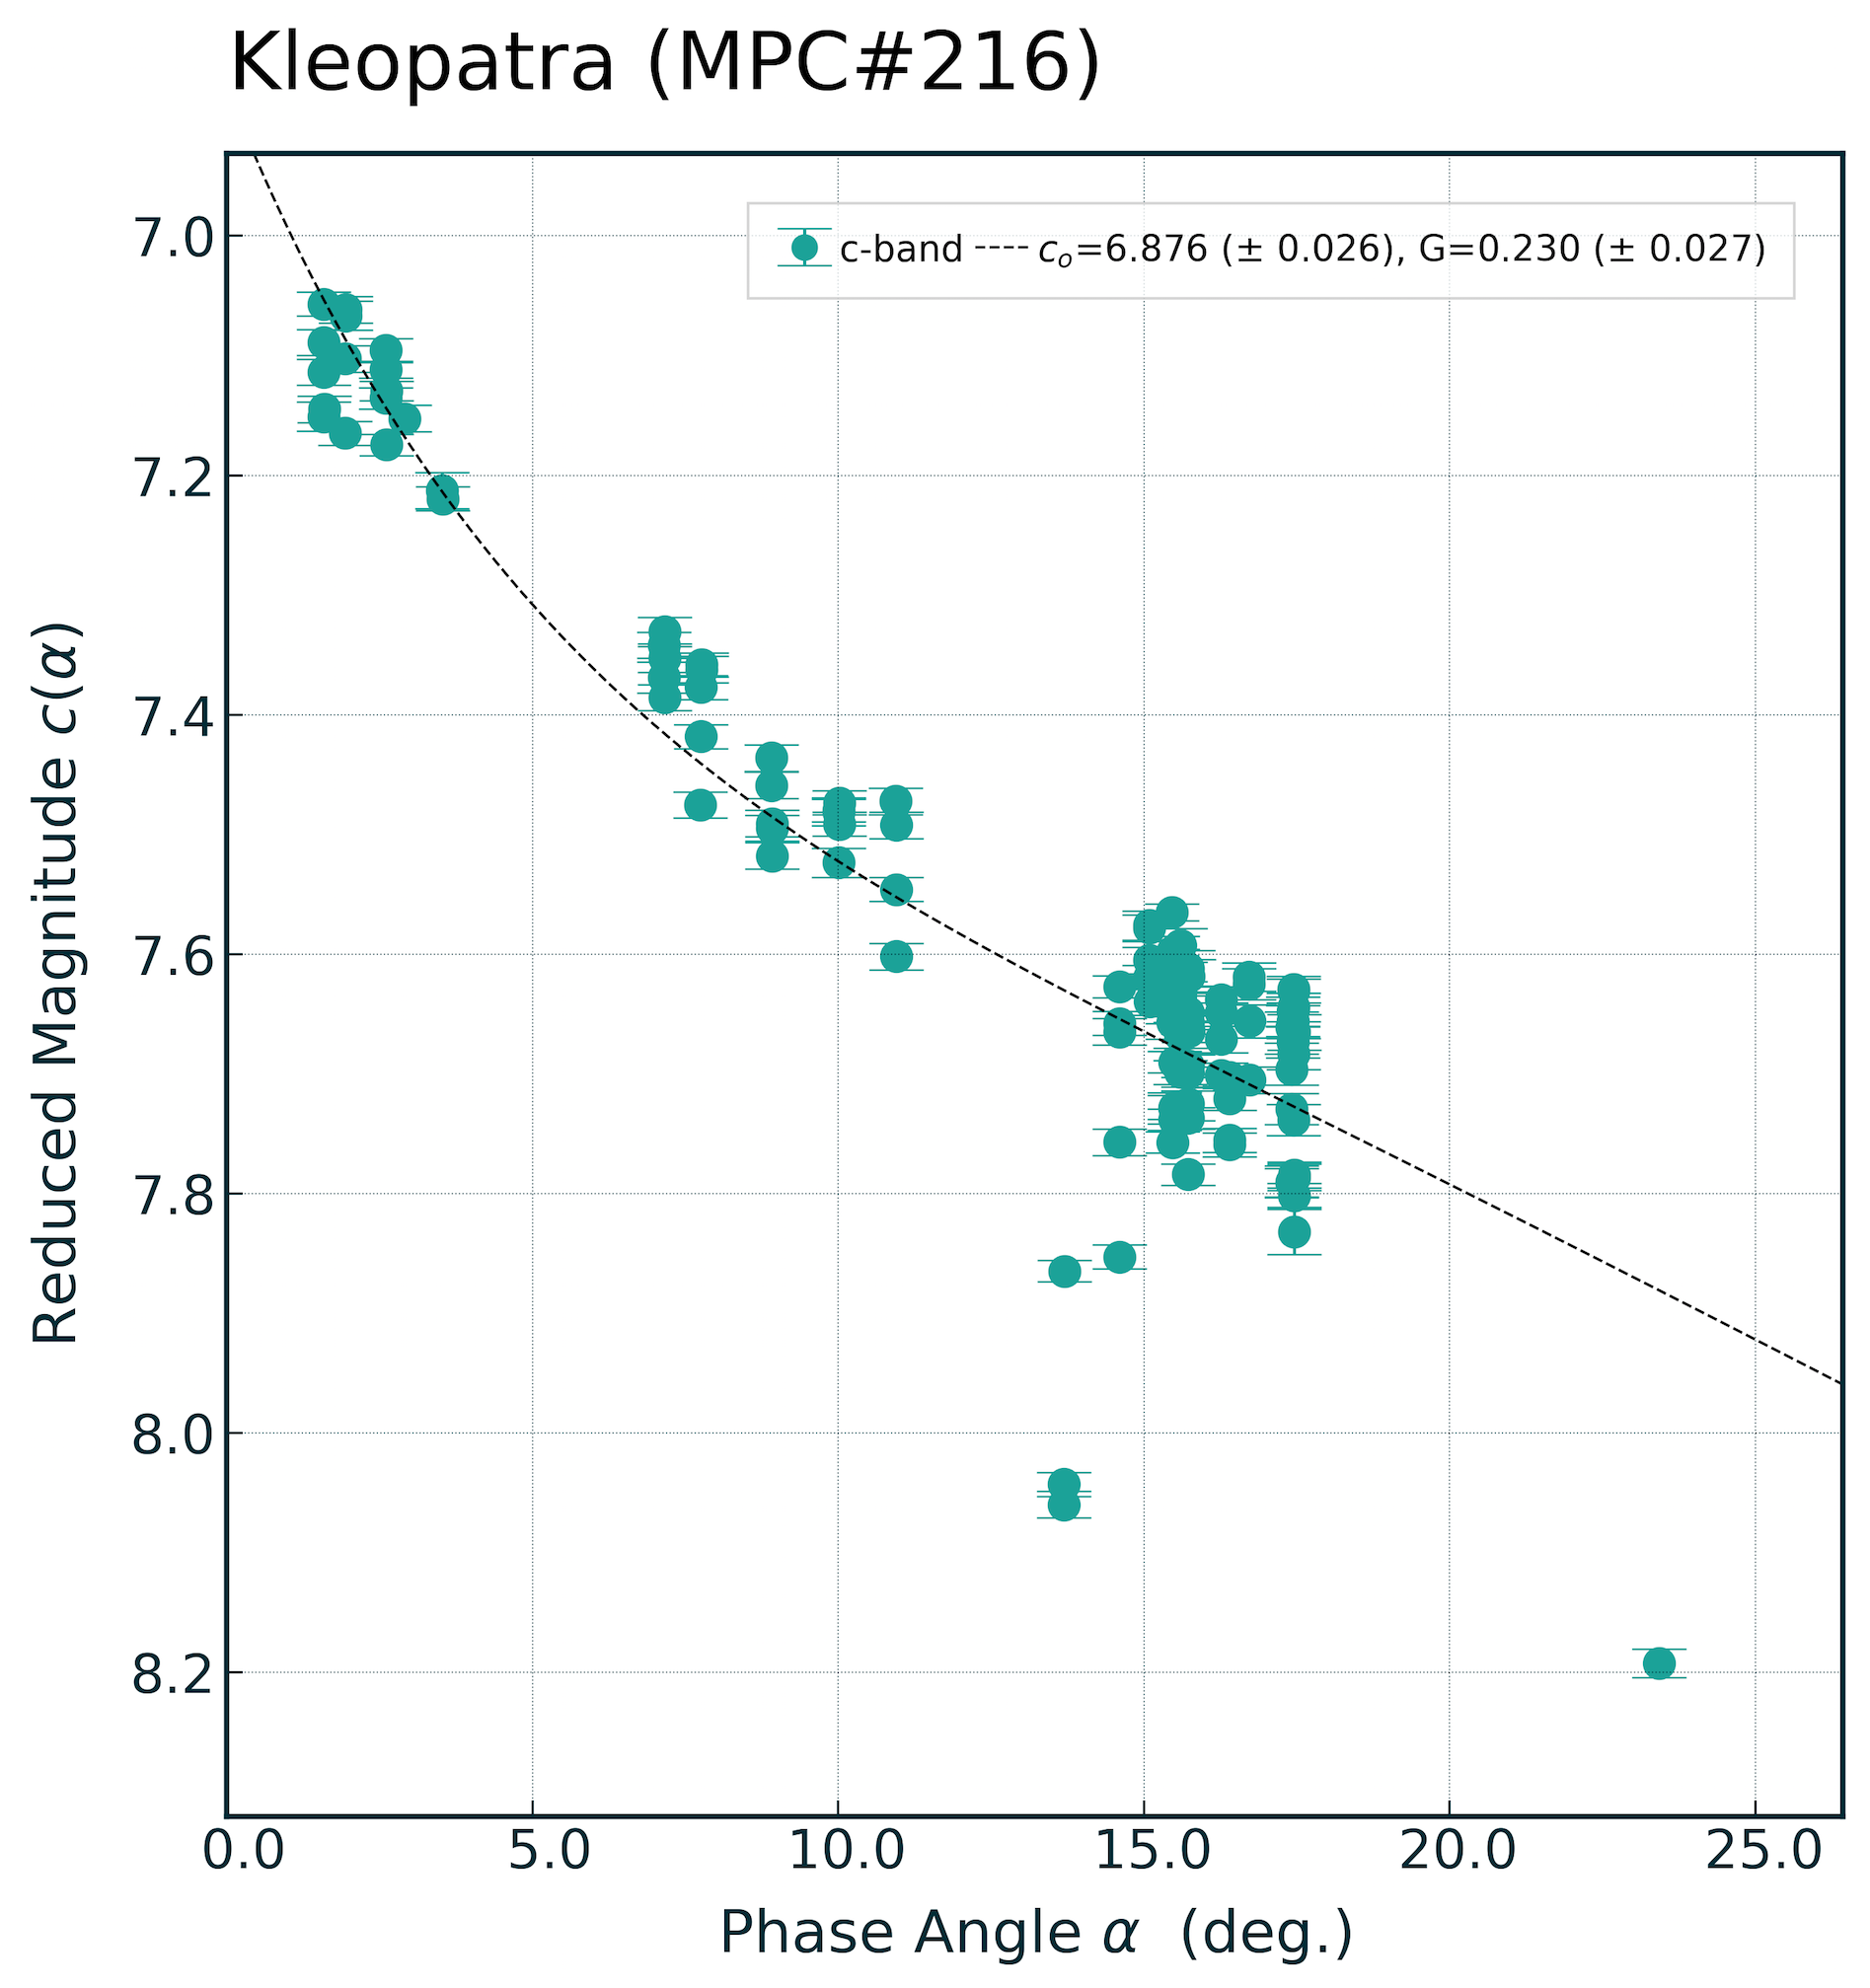
Here’s what the covariance matrix looks like for Kleopatra:
[
    [ 0.00066722  0.00066133]
    [ 0.00066133  0.00073213]
]
Taking the sqrt of the diagonals gives the \(1\sigma\) errors in G and H:
\(G_{err} = \sqrt{0.00066722}= 0.0258\),
and
\(H_{err} = \sqrt{0.00073213}= 0.0271\)
But these values seem ridiculously small given the range of scatter in the plot:
However, if I use the errors reported for \(c_0\) and \(G\) from the phase-curve fit to determine errors in the reduced magnitude \(c(\alpha)\) it’s easy to then visualise the reported uncertainties on the plot. To do this I have to calculate the maximum and minimum values for \(c_\alpha\) at any given phase-angle on the plot:
# THESE ARE THE H and G VALUES AND ERRORS OUTPUT FROM CURVE_FIT
H = popt[0]
G = popt[1]
Herr = perr[0]
Gerr = perr[1]

# GIVEN THE TWO VARIABLE PARAMETERS I HAVE TO CALCULATE 2^2 = 4 ARRAYS ...
nstd = 3 # 3 sigma range
p1 = magnitude_phase_func(
    phaseRange, popt[0] + nstd * perr[0], popt[1] + nstd * perr[1])
p2 = magnitude_phase_func(
    phaseRange, popt[0] - nstd * perr[0], popt[1] + nstd * perr[1])
p3 = magnitude_phase_func(
    phaseRange, popt[0] + nstd * perr[0], popt[1] - nstd * perr[1])
p4 = magnitude_phase_func(
    phaseRange, popt[0] - nstd * perr[0], popt[1] - nstd * perr[1])

# ... AND FIND THE MAXUMUM AND MINIMUM VALUES FOR H IN THE 4 ARRAYS
vHigh = np.maximum(np.maximum(p1, p2), np.maximum(p3, p4))
vLow = np.minimum(np.minimum(p1, p2), np.minimum(p3, p4))
And now I can plot the \(3\sigma\) uncertainties in the reduced magnitude \(c(\alpha)\):
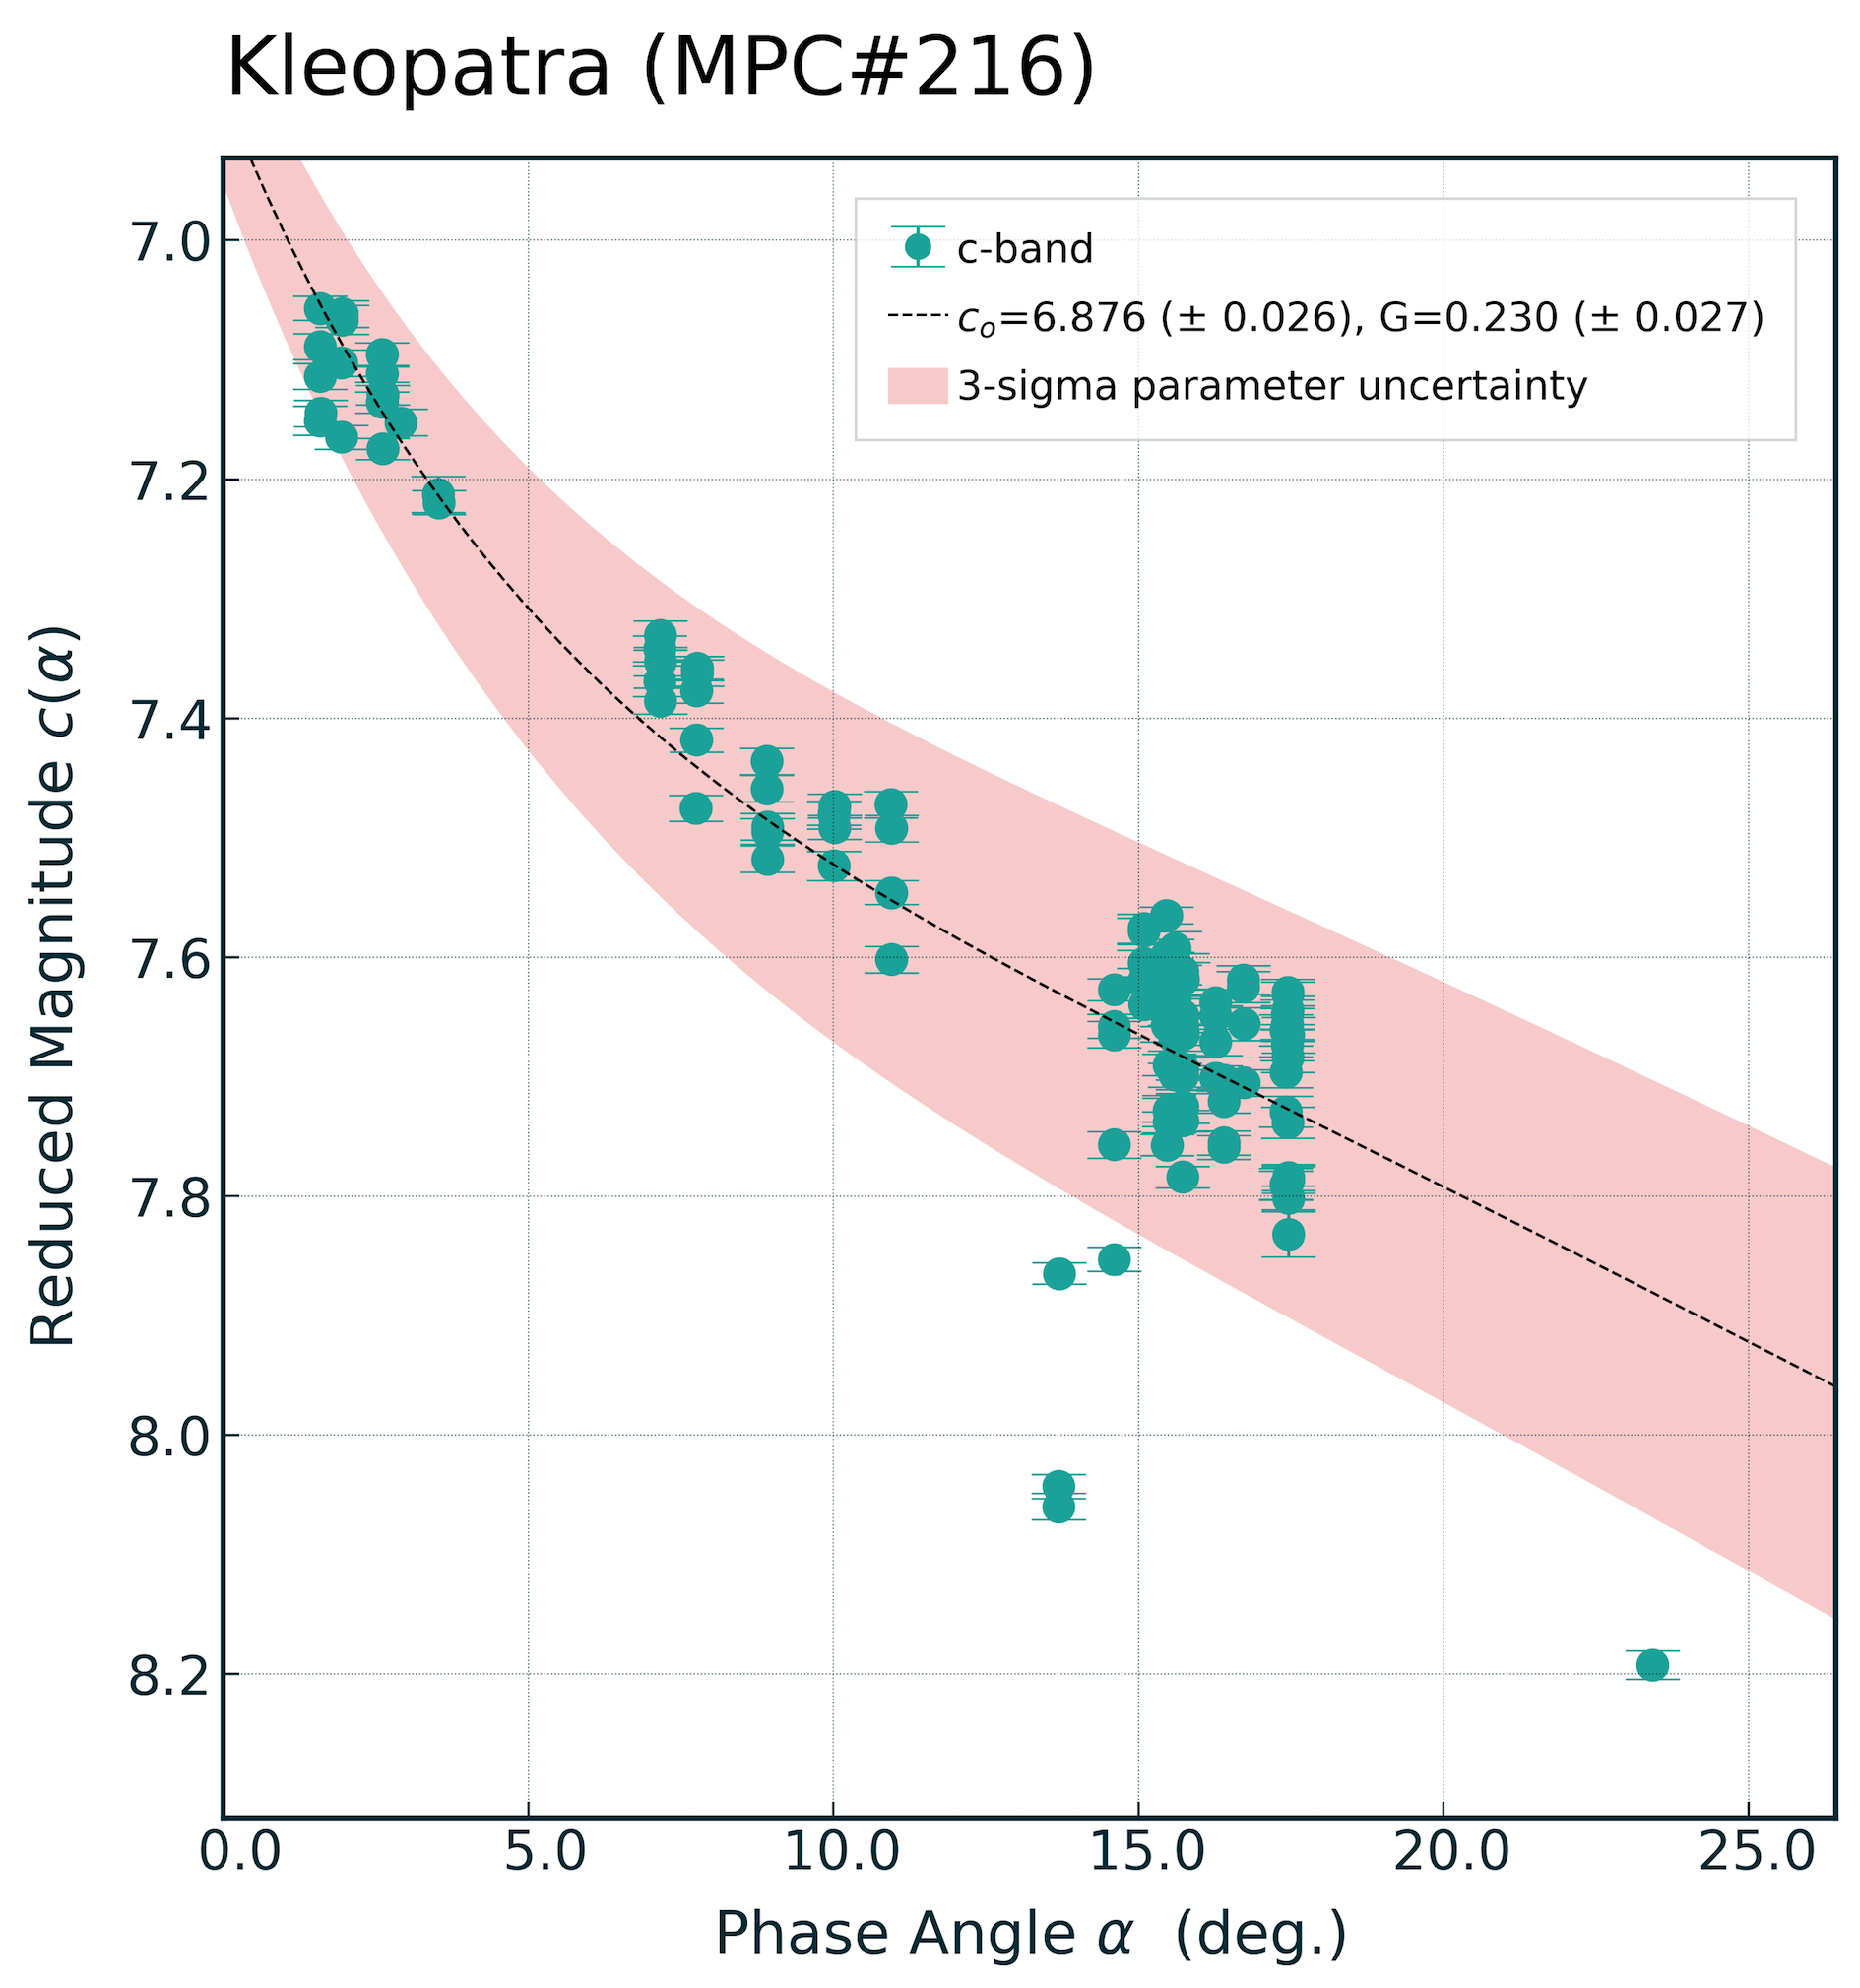
Now the errors look very sensible.
Weighting the Data
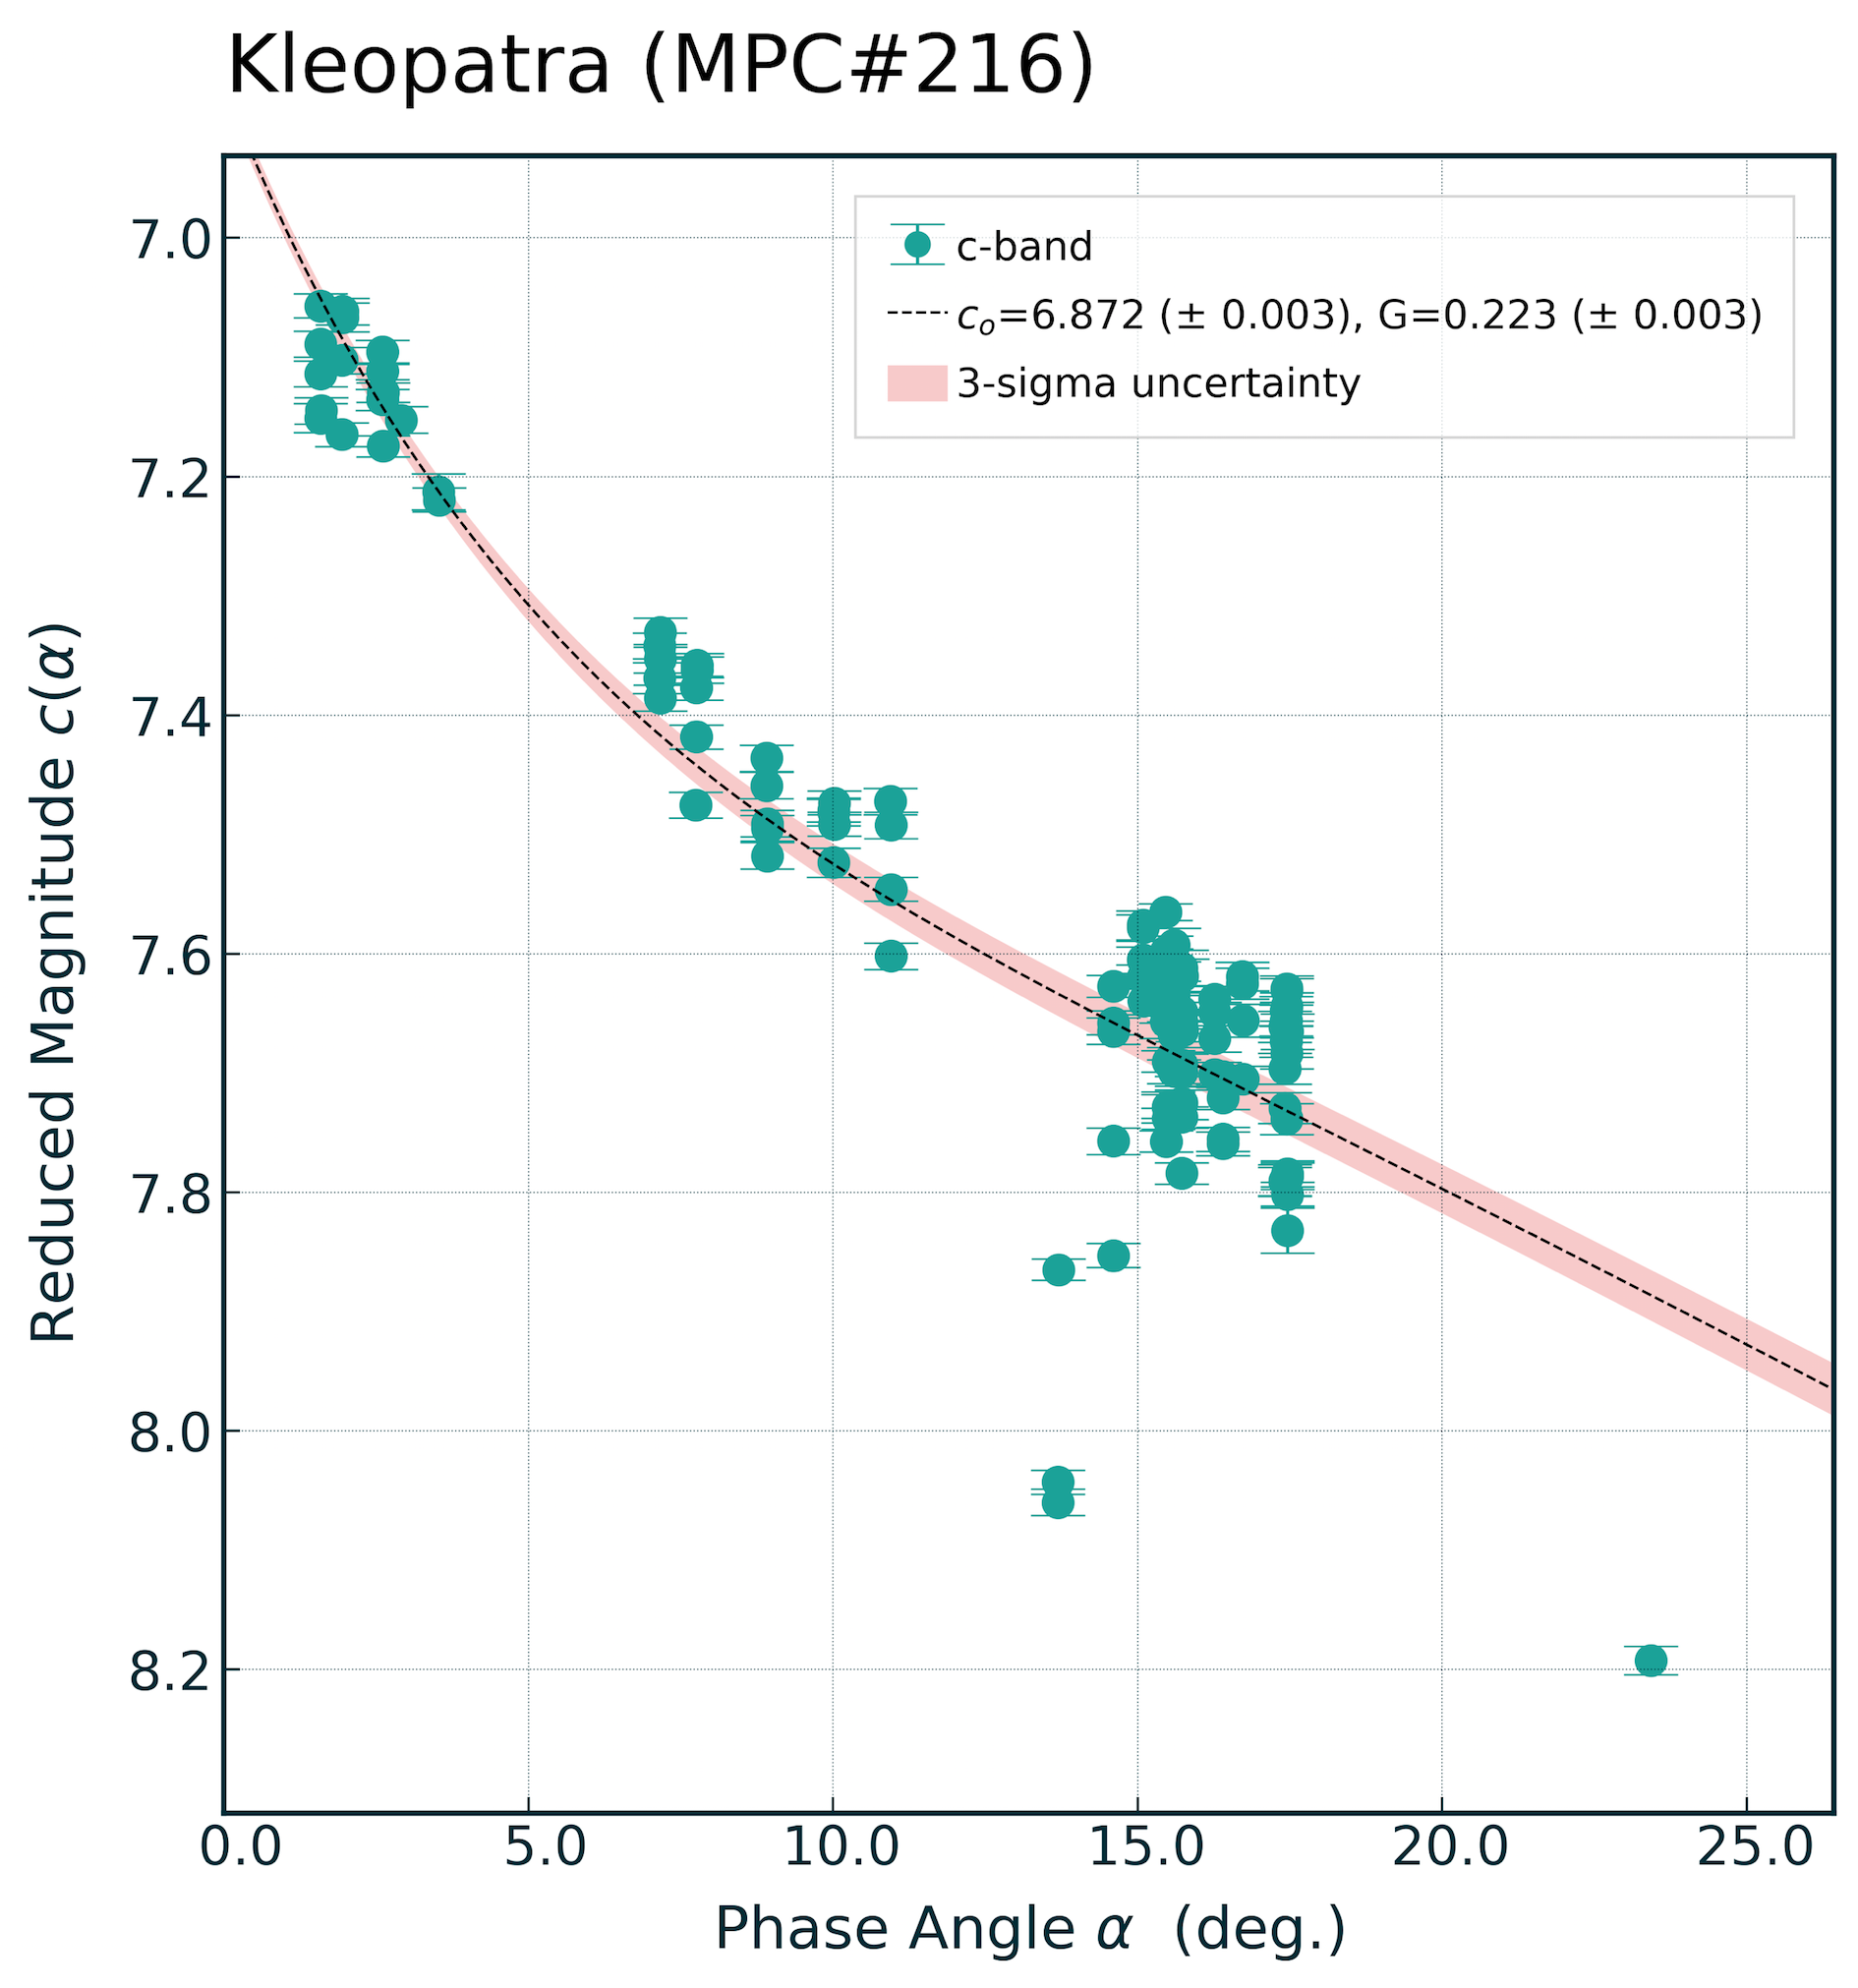
If I try and now weight the data to account for the photometry errors:
# WEIGHTING WITH PHOTOMETRY ERRORS
popt, pcov = curve_fit(magnitude_phase_func,
                       phase_radians, y, sigma=yerr, absolute_sigma=True)
The errors reduce dramatically (by almost an order on magnitude), revealing an uncertainty that no longer looks realistic:
The reason for this is because there’s is a hidden ‘error’ in the data that hasn’t been accounted for; asteroid rotation. For this reason we can’t reasonably state that the photometry errors in our data are ‘absolute’ in the sense that curve_fit, but rather they are relative. Settting absolute_sigma=False and we’re back on-track:
# WEIGHTING WITH PHOTOMETRY ERRORS
popt, pcov = curve_fit(magnitude_phase_func,
                       phase_radians, y, sigma=yerr, absolute_sigma=False)
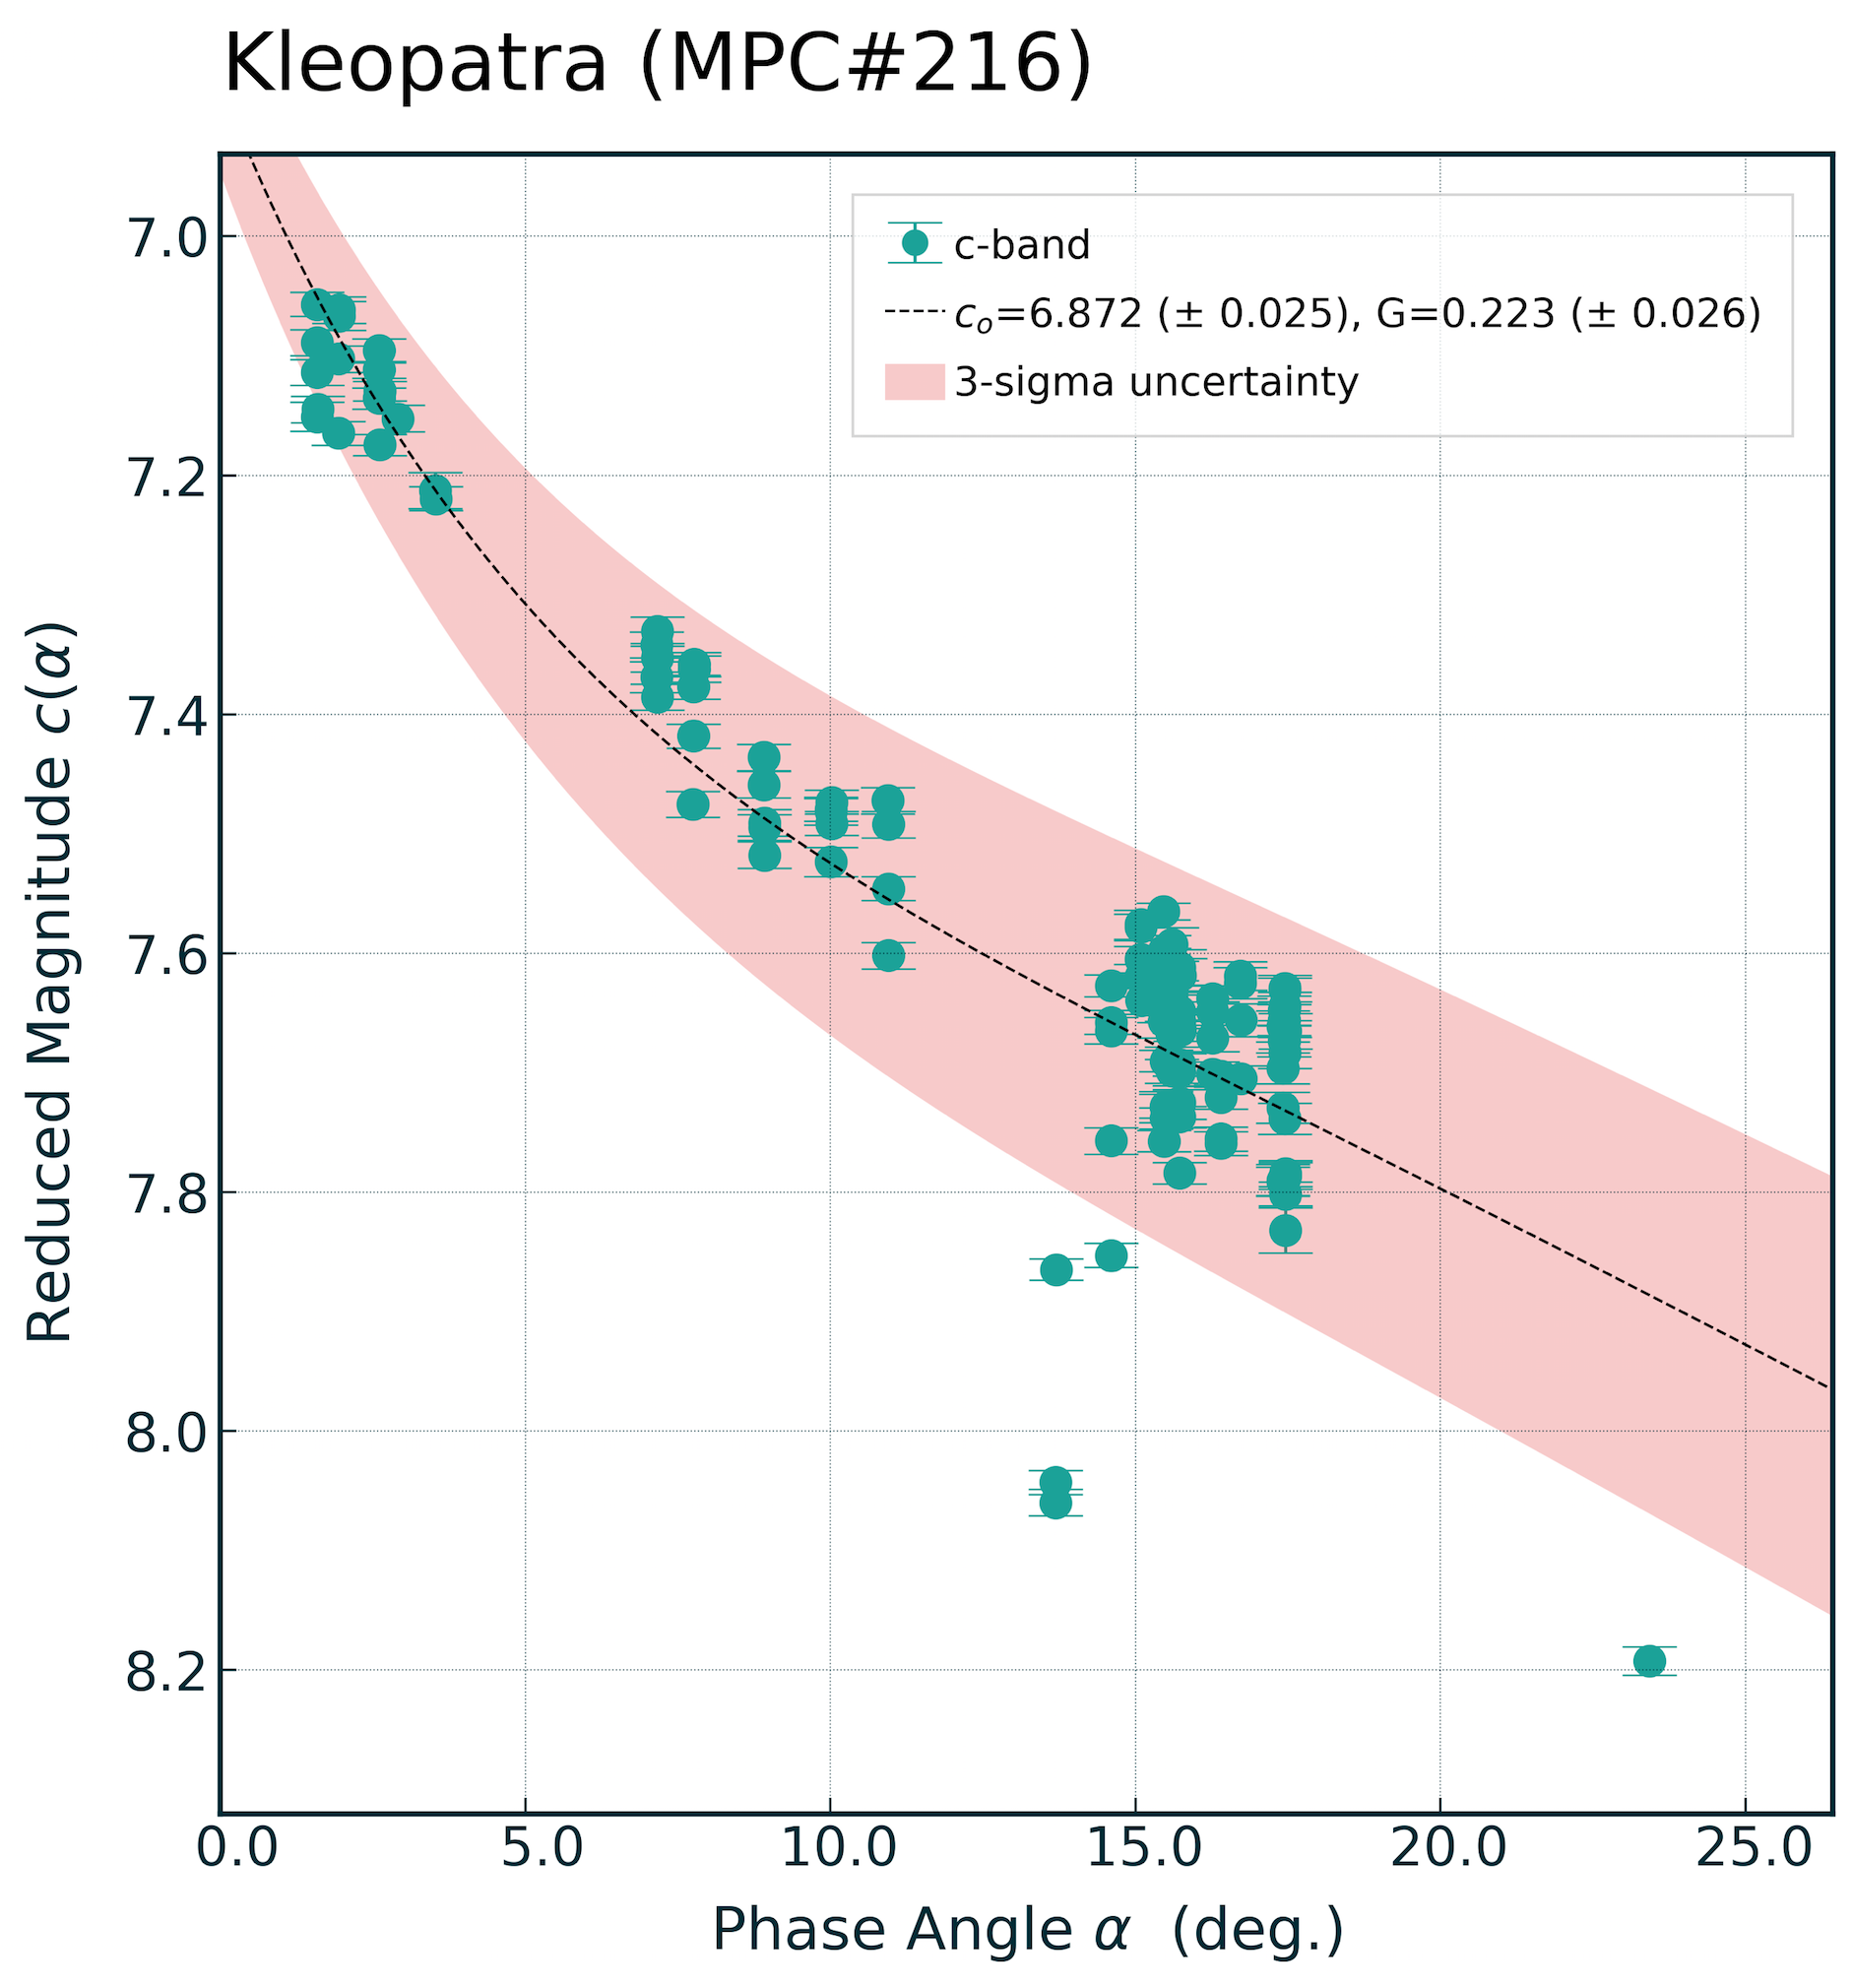
Because the errors in the data are dominated by the scatter in the photometry induced by rotation, including the measured photometric errors make little difference to the uncertainties.